
The modern workplace is evolving faster than ever. From how employees learn and grow, to what keeps them engaged, to who holds the most powerful seats in the room — the numbers tell a story that every HR leader, manager, and founder needs to hear.
Below, we've compiled the most important workforce statistics across six critical dimensions. Whether you're building a retention strategy, making the case for learning investment, or benchmarking your DE&I progress, this is your starting point.
1. Employee Development & Learning Statistics
Learning and development has quietly become one of the most powerful retention tools available — and the data makes it impossible to ignore.
Retention impact:
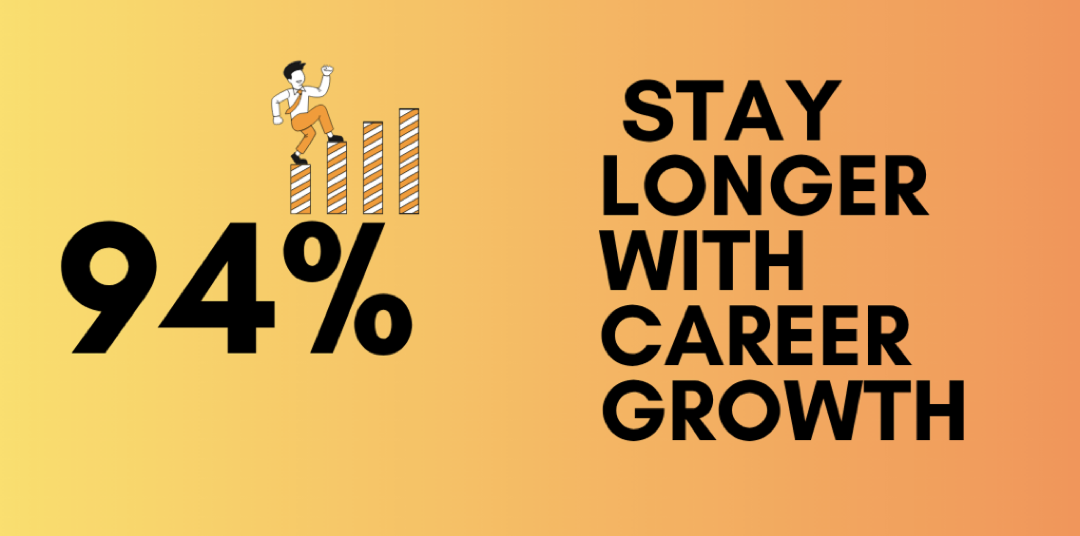
- 94% of employees say they would stay at a company longer if it invested in their career development.
- 90% of employees are more likely to stay at a company that offers learning and development opportunities.
- Companies with strong learning cultures see 2x higher employee retention rates compared to those without.
- Employees who are actively progressing in their careers are 20% more likely to stay with their current employer.
- Organizations that invest in development see 25–40% lower turnover than those that don't.
Why people leave:
- 41% of employees who left jobs cited lack of career development as a primary reason.
- 34% of employees left their previous position due to a lack of growth opportunities.
- Career development consistently ranks as one of the biggest drivers of employee satisfaction and retention.
The cost of getting it wrong:
- Replacing a single employee can cost anywhere from 33% to 213% of their annual salary — with many estimates landing at 200% for mid-level and senior roles.
How employees prefer to learn:
- 68% of employees prefer on-the-job training over classroom instruction.
- 47% of L&D teams plan to incorporate microlearning into their programs.
- eLearning can boost knowledge retention rates by up to 60% compared to traditional instruction.
- 70% of workers say learning improves their sense of connection to their workplace.
- 80% of workers say learning adds purpose to their work.
Organizational adoption:
- 96% of large and mid-size companies already use a Learning Management System (LMS); 81% of small companies have followed suit.
- 53% of organizations have made upskilling and reskilling a formal priority.
- 47% of companies now use coaching specifically to improve employee retention.
- Learning opportunities are the top retention strategy cited by 90% of companies.
2. Employee Turnover & Retention Statistics
The benchmark most people still quote on small business retention comes from a 2019 Zenefits survey of more than 600 US businesses with 50 to 500 employees, published on its Workest site. The report is gone. We pulled the numbers and put each one next to where it sits in 2026.
Retention versus hiring
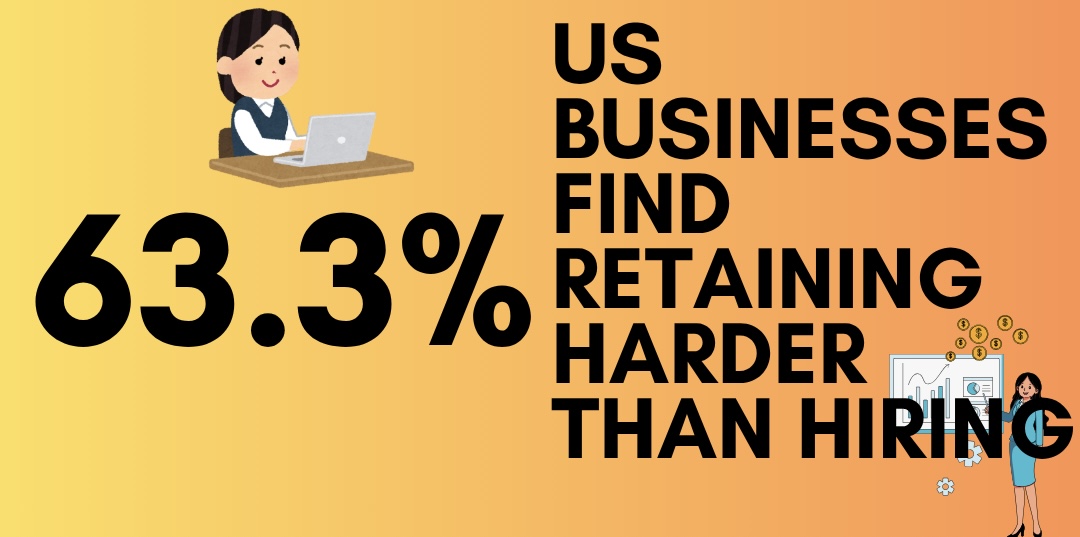
Then: 63.3% of companies said retaining employees is harder than hiring them. 19.2% were neutral and 17.6% disagreed. That was a tight labor market with more openings than qualified applicants, and workers held the leverage.
Now: the leverage moved. The quits rate has fallen from 2.3% in 2019 to 2.0% as of June 2026, around 3.2 million people a month. Hiring cooled with it, and employers are holding onto staff rather than risk refilling a role later, a pattern now called labor hoarding. 47% of small business leaders still say finding skilled professionals is harder than it was a year ago.
How costly employers consider turnover
Then: 81% of business owners agreed employee turnover is a costly problem.
Now: nobody has re-run that exact question, but the cost estimates went up rather than down. SHRM puts replacement at 50% to 200% of annual salary depending on the role.
What turnover costs the US economy
Then: this study is the source usually credited for the claim that US employers spend $2.9 million a day looking for replacement workers, or roughly $1.1 billion a year. The figure does not appear anywhere in the original report. It looks like a compression of Gallup's estimate that a 100-person company paying an average of $50,000 carries $660,000 to $2.6 million a year in turnover and replacement costs.
Now: the real national number is far larger. Gallup puts the cost of voluntary turnover to US businesses at about $1 trillion a year, which works out to roughly $2.7 billion a day. Anyone still citing $2.9 million a day is understating the problem by a factor of about a thousand.
The five biggest costs of losing an employee
Then, ranked by the employers surveyed:
- Delays to customer projects or services: 24.5%
- Loss of productivity: 21.1%
- Cost of re-hiring and onboarding a replacement: 17.2%
- Damage to team or company morale: 15.6%
- Stress on the immediate team: 10.6%
Now: the ranking holds up, and the reason it does is that recruiting fees were never the main expense. Around two thirds of turnover cost is soft cost, meaning lost productivity, lost knowledge, and the errors that follow. Employers were already reporting that in 2019. The line item that hurt first was work going out the door late.
Why employees left
Then, in order:
- Higher earnings at another job
- Poor interpersonal relationships, usually conflict with a manager or colleagues
- Personal life changes such as marriage, relocation, a new child, or illness
- A better benefits package at another company
- A promotion or wider responsibilities elsewhere
Now: pay is still first. A 2026 resume.org survey found workers rank pay, job security, and work-life balance as their top priorities, with only 20% saying they are very satisfied with what they earn. What changed is how many act on it. 18% say they are very likely to job hunt in 2026, rising to 57% among Gen Z.
What employers did about it
Then: 53.2% increased employee recognition, 51.4% raised salaries or hourly wages, 41.3% improved benefits.
Now: recognition went from a tactic to standard equipment, with 80% of organizations running a formal recognition program. Pay is the harder lever in a slower market, which is pushing more employers toward development and internal mobility instead.
3. Employee Recognition Statistics
Recognition is one of the lowest-cost, highest-return levers in HR — yet it's still widely underutilised.
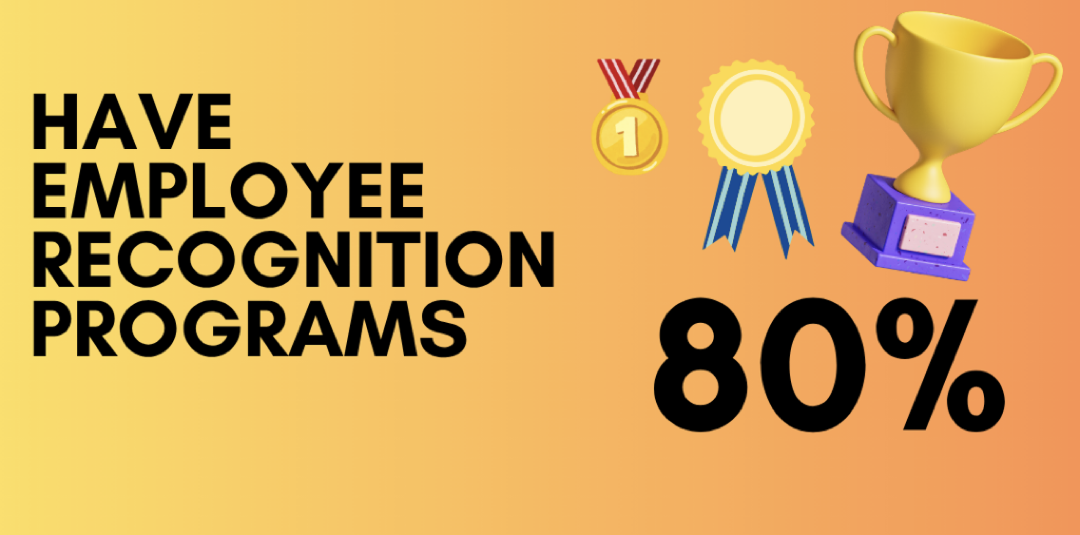
- 80% of organizations have a formal employee recognition program in place.
- 68% of HR managers credit their recognition and rewards programs for positive retention outcomes.
- 68% of HR professionals say recognition has a direct positive impact on employee engagement.
- Despite widespread program adoption, employees who feel consistently recognized report significantly higher engagement, productivity, and loyalty.
Recognition doesn't have to be expensive — but it does have to be consistent and genuine. Organizations that build recognition into their culture, rather than treating it as a quarterly event, are the ones seeing measurable retention gains.
4. Employee Engagement & The Power of Being Heard
Engagement isn't just a feel-good metric — it has direct, quantifiable business outcomes.
Engagement and retention:
- The most cited statistic in this field comes from Driving Performance and Retention Through Employee Engagement, a 2004 Corporate Leadership Council study of 50,000 employees at 59 global organizations, published by the Corporate Executive Board. The PDF everyone linked to is no longer online, so the findings are preserved here.
- Highly engaged employees were 87% less likely to leave their organizations. Gallup's current figures are more conservative: 21% less turnover in organizations that already churn heavily, and 51% less in low-turnover ones.
- The most committed employees performed 20% better than average.
- More than 1 in 10 employees were fully disengaged, and those employees were four times more likely to leave than the average worker.
Voice and empowerment:
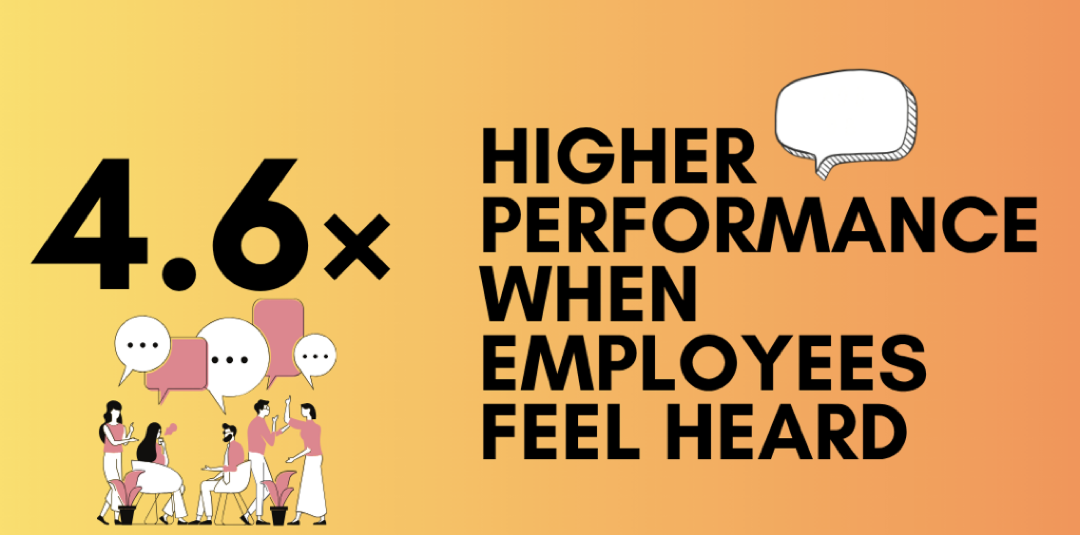
- Employees who feel their voice is heard are 4.6x more likely to perform at their best.
- 74% of employees who feel heard are more likely to feel empowered in their role.
- Only 20% of employees globally are engaged at work, with 64% not engaged and 16% actively disengaged. The US and Canada lead at 31%, which still means roughly two-thirds of North American workers are checked out to some degree.
Communication as a retention driver:
- Businesses that communicate effectively have 50% lower employee turnover than those that don't.
- 43% of leaders say poor internal communication decreases productivity on their teams.
- The average employee achieves only about 60% of their potential productivity on any given workday — often due to unclear direction, disengagement, or poor communication.
- Relationships with colleagues were considered one of the most important factors in determining job satisfaction by 77% of respondents in a 2019 survey conducted by Institute of Leadership & Management. While there have been no recent updates to this study, the statistic likely still holds true.
Organizational priority:
- 80% of organizations identify improving employee morale and engagement as a top priority.
- Yet the gap between intent and execution remains wide. Companies that close it — through consistent feedback loops, manager training, and genuine two-way communication — consistently outperform peers on both retention and performance metrics.
5. Workplace Well-being & Productivity Statistics
Well-being is no longer a "nice to have." Employees have made clear that it's a dealbreaker — and the data backs them up.
Well-being and performance:
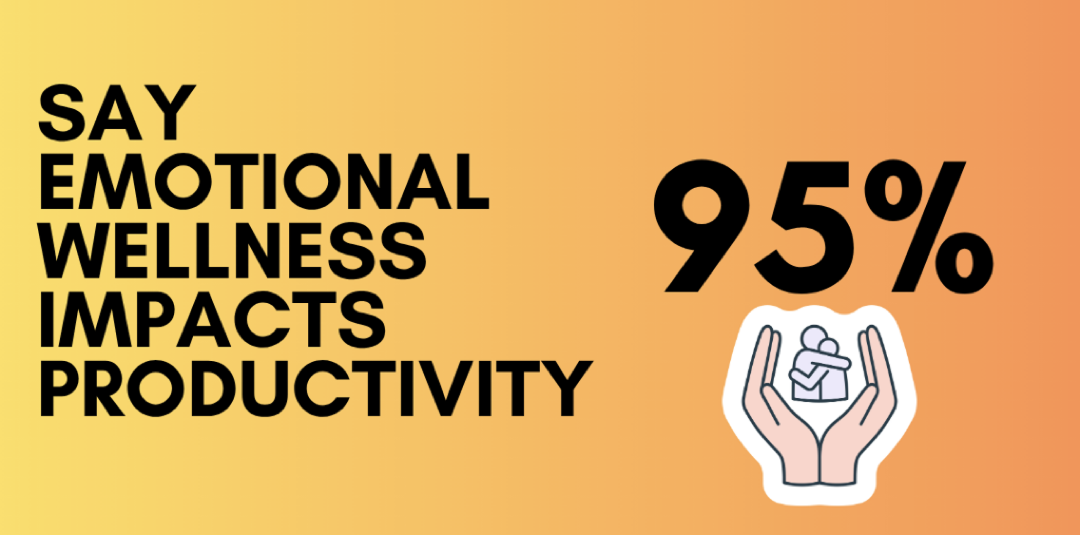
- 95% of employees say their emotional wellness directly impacts their productivity.
- 93% of workers say physical well-being affects their ability to perform at work.
- 92% of employees want to work for a company that actively values their wellbeing.
Flexibility as a non-negotiable:
- 76% of millennials expect flexible working conditions from their employer.
- 39% of employees say they would immediately quit if their work-from-home or work-from-anywhere options were revoked.
Technology and automation:
- 82% of leaders believe employees will need new skills due to the rise of AI and automation.
- 78% of workers who automate routine tasks report meaningful productivity gains.
- Workplace automation saves the average employee 3.3 hours per week — time that can be redirected toward higher-value work.
The skills gap:
- 60% of employers report not hiring applicants due to insufficient interpersonal and soft skills — a challenge that grows as technical roles multiply but human skills remain scarce.
- Skills shortages are worsening globally, and organizations that invest in continuous learning are best positioned to close the gap internally.
6. The Future of Work & Remote Work Statistics
The nature of work itself is shifting — and the organizations adapting fastest are pulling ahead.
AI in HR:
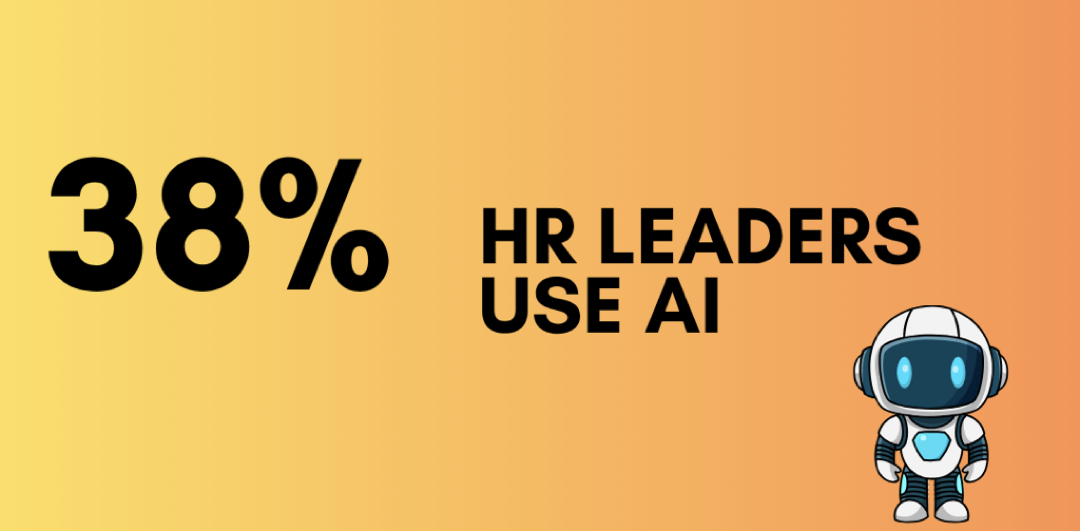
- 38% of HR decision-makers currently use AI in some aspect of their HR function.
- AI adoption in HR is accelerating, particularly in recruitment screening, performance analysis, and workforce planning.
The Salesforce economy and job creation:
- The Salesforce ecosystem alone was projected to create 3.3 million new jobs — a signal of how platform ecosystems are reshaping workforce demand.
Communication and non-verbal dynamics:
- Research suggests that up to 93% of communication is non-verbal — meaning how managers lead meetings, give feedback, and navigate change is as important as what they say.
- Managers remain central to navigating workplace change. Companies that invest in manager effectiveness during transitions — remote shifts, restructures, AI adoption — see faster stabilization and lower attrition.
Remote work as retention:
- The data is unambiguous: remote and hybrid flexibility is now a primary retention factor, not a perk. Organizations still treating it as optional are operating at a competitive disadvantage in talent markets.
7. Women in the Workforce Statistics
Progress has been made — but the numbers reveal how much further the path goes.
Representation:
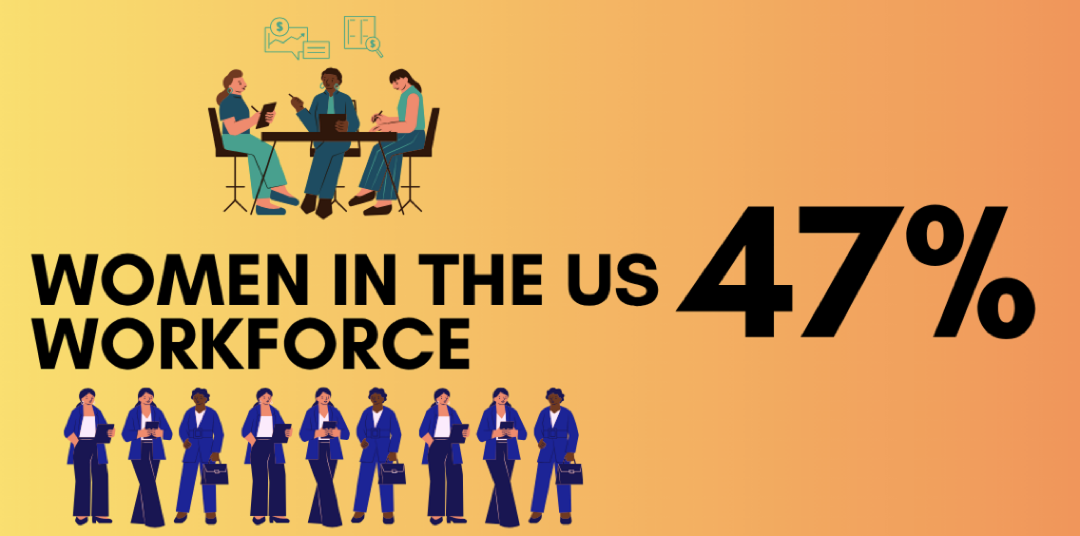
- Women make up approximately 47% of the U.S. labor force.
- Women hold more than half of management, professional, and related positions at lower and mid-levels.
- Yet only 34% of senior management positions are held by women — despite comprising nearly half the workforce.
The leadership gap:
- Men are 2–3x more likely than women to hold senior management positions.
- Men occupy over 60% of management-level roles overall.
- Women hold only around 20% of Fortune 500 board seats.
- Women hold 5.2% of Fortune 500 CEO positions — a figure that has improved slightly since the 2017 benchmark of ~5%, but remains disproportionately low.
- In the technology sector, women hold just 15% of board-level positions, compared to the Fortune 500 average of ~22%.
- Globally, women hold approximately 12% of directors' board seats (as of the most recent comparable data).
Canada benchmark:
- In Canada, women hold roughly one-third of senior management positions — a figure frequently cited as a regional benchmark for comparison.
Progress and trajectory:
- Women's representation in management has grown, but the pace remains slow relative to their workforce participation.
- The pipeline is not the primary problem — women are well-represented in entry-level and mid-level professional roles. The gap widens sharply at the VP, C-suite, and board levels.
- Organizations with higher gender diversity in leadership consistently outperform peers on profitability, employee engagement, and innovation metrics.
Key Takeaways
The workforce data tells a clear story: employees want to grow, feel heard, stay well, and see themselves reflected in leadership. The organizations that build systems around those four pillars — continuous development, genuine recognition, psychological safety, and inclusive leadership — are the ones winning on retention, engagement, and performance.
Sources: LinkedIn Workplace Learning Report, McKinsey & Company, Salesforce Research, Gallup, Bureau of Labor Statistics, Catalyst, Deel/YouGov, SHRM, and additional industry research.








.png&w=3840&q=75)